Cloudflare Data Platform Demo — Live Datasets on R2 + R2 SQL
## Overview
A showcase of Cloudflare's data-platform architecture running end to end on the Developer Platform. Ten Worker services — five Collectors and five Aggregators — pull from six public APIs (Open-Meteo, GitHub Events, Hacker News, GBFS bikeshare, CoinGecko, and npm) and split every dataset across two paths: a cold path that streams raw events through Cloudflare Pipelines into R2 Iceberg tables, and a hot path that publishes compact snapshots to Workers KV. Aggregator Workers turn the raw events into dashboard-ready metrics written back to KV, so the Astro 6 SSR app (React 19 islands, Tailwind, D3, and MapLibre) renders five live dashboards — weather, developer zeitgeist, micromobility, crypto, and framework downloads — with data already in the HTML on first paint. An Explore mode generates schema-aware, validated SQL from natural-language questions via Workers AI, previews results client-side, and can execute the query against R2 SQL over the Iceberg tables for deeper analysis.
## Highlights
- -> Ten Worker services — five Collectors + five Aggregators — ingest six public APIs into a shared data platform
- -> Dual-path design: cold path streams raw events through Cloudflare Pipelines into R2 Iceberg tables; hot path publishes KV snapshots
- -> Astro 6 SSR reads KV directly so five dashboards paint with live data on first load (zero client round-trip)
- -> Explore mode: Workers AI turns natural-language questions into schema-aware, validated SQL
- -> Validated SQL runs against R2 SQL over the Iceberg tables, with a client-side preview fallback
## Architecture
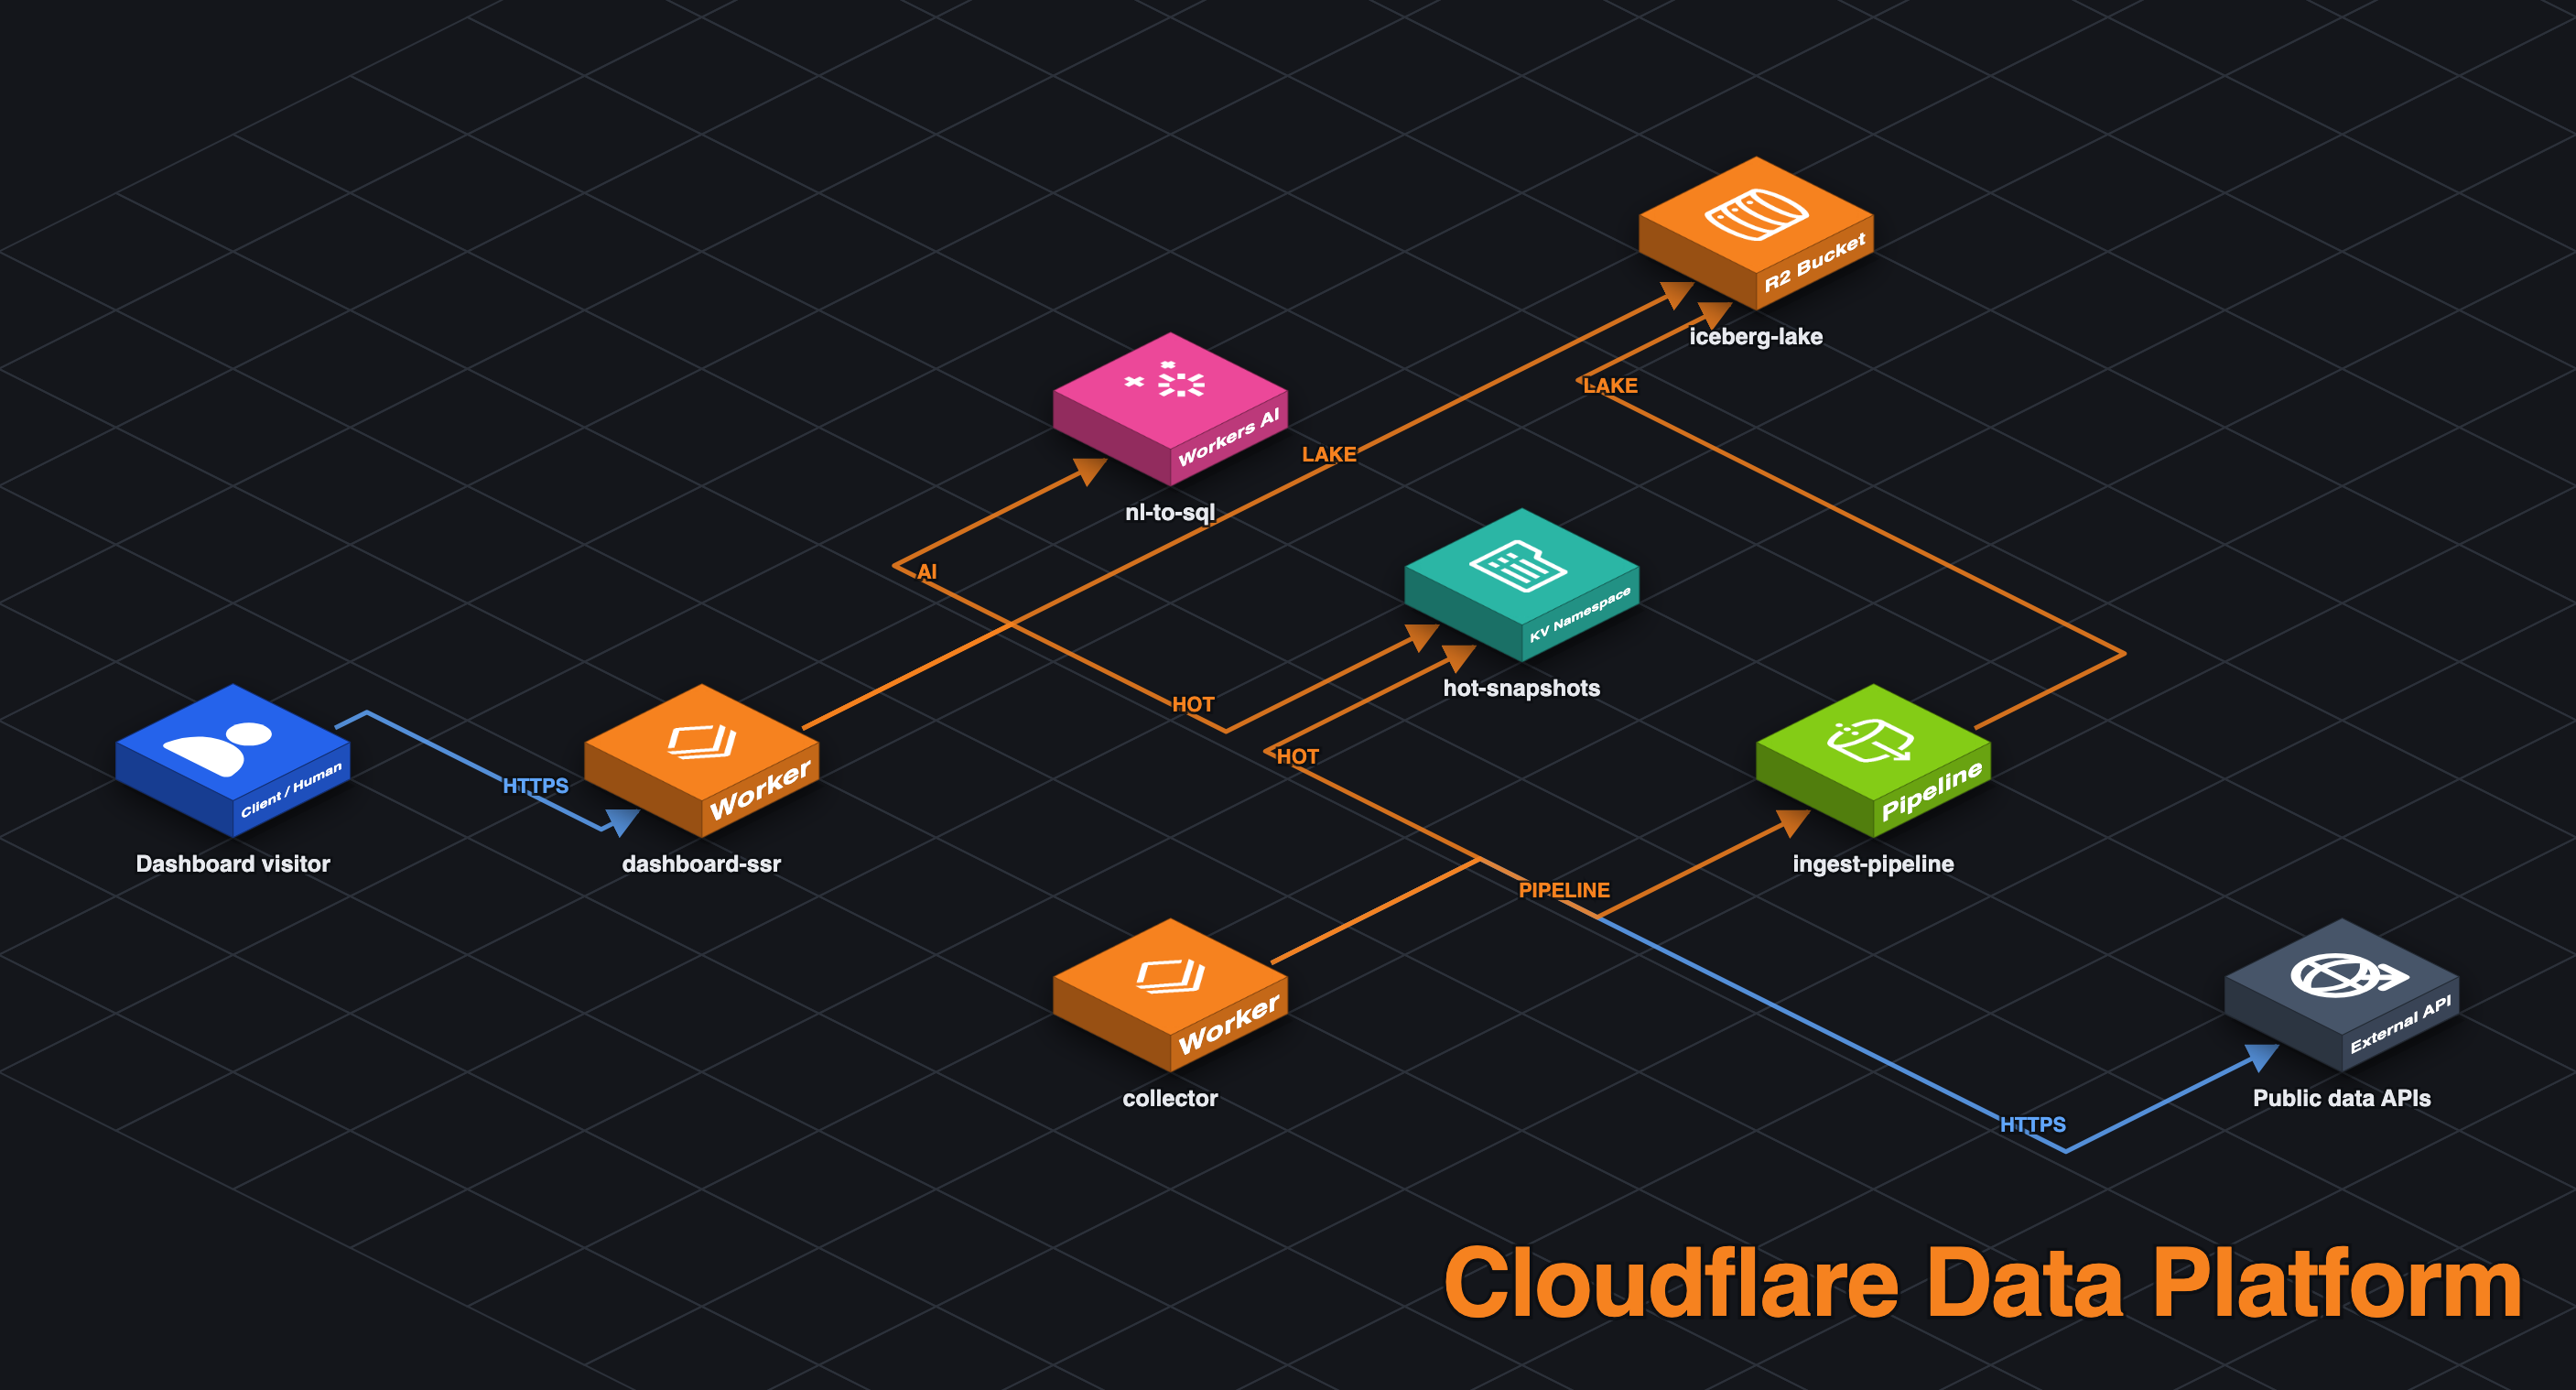
Public APIs (Open-Meteo, GitHub, HN, GBFS, CoinGecko, npm)
    ▼
Collector Workers (×5)
    ├── cold path → Cloudflare Pipelines → R2 (Iceberg tables)
    └── hot path  → Workers KV (compact snapshots)
    ▼
Aggregator Workers (×5) ── raw events → dashboard metrics → KV
    ▼
Astro SSR app (React islands + D3 + MapLibre)
    ├── reads KV directly → 5 live dashboards on first paint
    └── Explore + AI routes
            ├── Workers AI ── natural language → validated SQL
            └── R2 SQL ────── query Iceberg tables (preview fallback)